 Youtube Link
Test Metrics Tutorial: A Comprehensive Guide
Table of Contents
- Introduction to Test Metrics
- What are Test Metrics?
- When to Use Test Metrics
- Why Test Metrics are Needed
- Objective and Requirements of Test Metrics
- Types of Test Metrics
- Identifying Metrics
- Manual Test Metrics
- Advantages of Test Metrics
- Disadvantages of Test Metrics
- Example Execution of Test Metrics in Real Scenarios
Introduction to Test Metrics
Test metrics are quantitative measures used to assess the quality, progress, and efficiency of software testing activities. These metrics provide valuable insights into the effectiveness of the testing process and help stakeholders make informed decisions about the product's readiness for release.
In this tutorial, we will explore the concept of test metrics, Learn and understand when and why to use test metrics, discuss their objectives and requirements, explore different types of test metrics, examine their advantages and disadvantages. Additionally, we will provide an example execution of test metrics in real scenarios.
What are Test Metrics?
Test metrics are quantitative measurements derived from the testing process. They provide valuable data on various aspects of testing, such as test coverage, test progress, defect density, and test effectiveness. These metrics help evaluate the quality of the software being tested, identify areas for improvement, and facilitate data-driven decision-making.
Test metrics are quantitative measures or indicators used to assess and evaluate various aspects (like quality, progress, and efficiency) of the software testing process.
When to Use Test Metrics
Test metrics should be used throughout the software testing lifecycle to track and monitor the progress and effectiveness of testing activities. They are particularly useful in the following scenarios:
- Evaluating the overall quality and readiness of the software for release.
- Identifying areas of the application that require additional testing.
- Assessing the performance of the testing team or individual testers.
- Comparing different testing approaches or strategies.
- Providing objective data to stakeholders for decision-making.
Why Test Metrics are Needed
The aim of collecting test metrics is to use the data for improving the test process. This includes finding answers to the questions like:
| |
| --- | --- |
| - How long will it take to test?
- How much money will it take to test?
- How bad are the bugs?
- How many bugs found were fixed? reopened? closed? deferred?
- How many bugs did the test team did not find?
- How much of the software was tested?
| - Will testing be done on time? Can the software be shipped on time?
- How good were the tests? Are we using low-value test cases?
- What is the cost of testing?
- Was the test effort adequate? Could we have fit more testing in this release?
|
Test metrics play a crucial role in software testing for the following reasons:
- Quantitative Assessment: Test metrics provide objective measurements of various aspects of the testing process, enabling stakeholders to assess the quality and progress of testing activities.
- Decision-making: Metrics help stakeholders make informed decisions regarding the release readiness of the software, prioritization of testing efforts, and resource allocation.
- Continuous Improvement: By tracking metrics over time, testing teams can identify trends, patterns, and areas for improvement in their testing practices.
- Communication: Metrics provide a common language to communicate the status and effectiveness of testing to stakeholders, fostering collaboration and transparency.
Objective and Requirements of Test Metrics
The objectives of using test metrics include:
- Evaluating the quality and effectiveness of the testing process.
- Identifying defects, bottlenecks, and areas of improvement.
- Assisting in decision-making and resource allocation.
- Providing visibility and transparency to stakeholders.
To meet these objectives, test metrics must fulfill the following requirements:
- Relevance: Metrics should measure meaningful aspects of the testing process and align with the project's goals and objectives.
- Accuracy: Metrics should be based on reliable data sources and calculated using appropriate formulas or algorithms.
- Consistency: Metrics should be consistently measured and reported to enable effective comparison and trend analysis.
- Actionability: Metrics should provide actionable insights that help identify areas for improvement and drive decision-making.
Types of Test Metrics
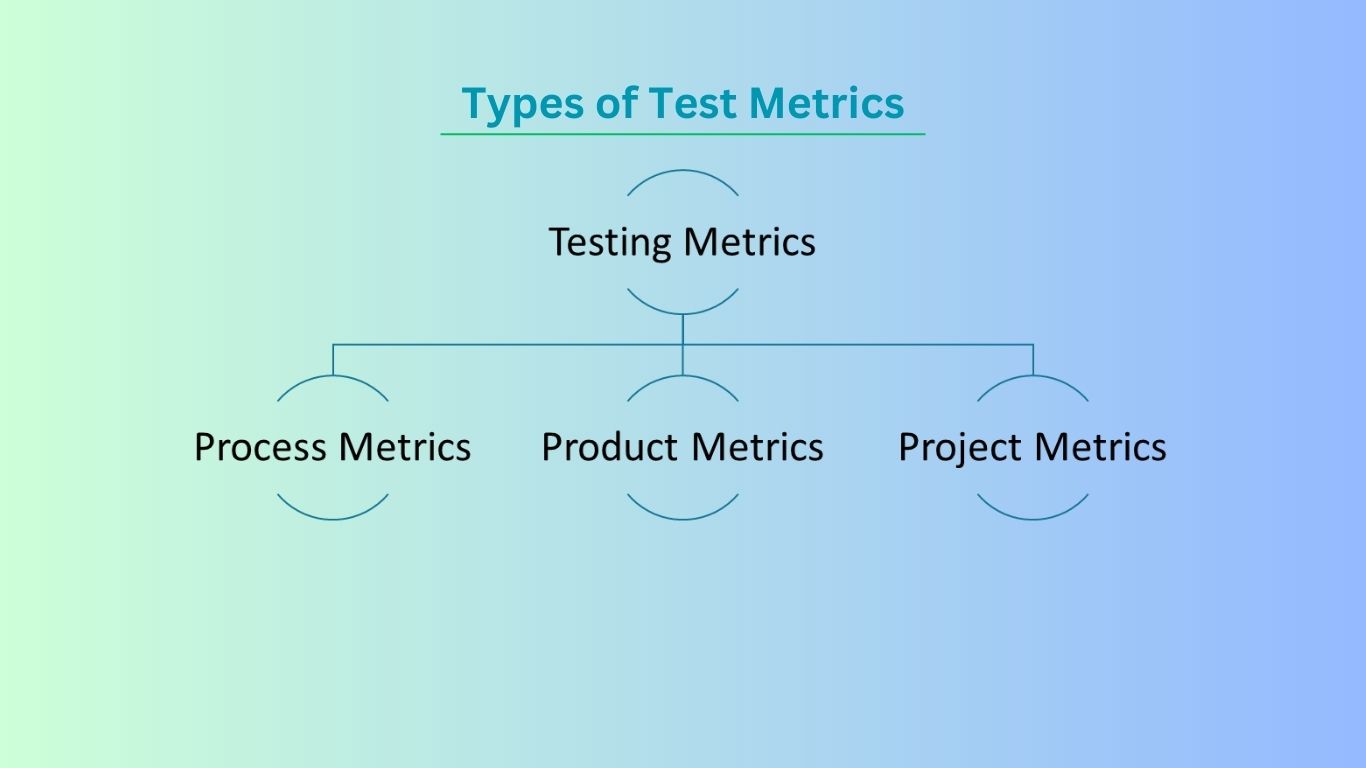
There are three types of test metrics that provide insights into different aspects of testing.
- Process Metrics: Used to improve the process efficiency of the SDLC ( Software Development Life Cycle)
- Product Metrics: Deals with the quality of the software product
- Project Metrics: Used to measure the efficiency of a project team or any testing tools being used by the team members
Some common test metrics include: To Learn more Click Here
Identifying Metrics
- Identification of correct testing metrics is very important.
- Few things need to be considered before identifying the test metrics
- Fix the target audience for the metric preparation
- Define the goal for metrics
- Introduce all the relevant metrics based on project needs
- Analyze the cost benefits aspect of each metrics and the project lifestyle phase in which it results in the maximum output
Manual Test Metrics
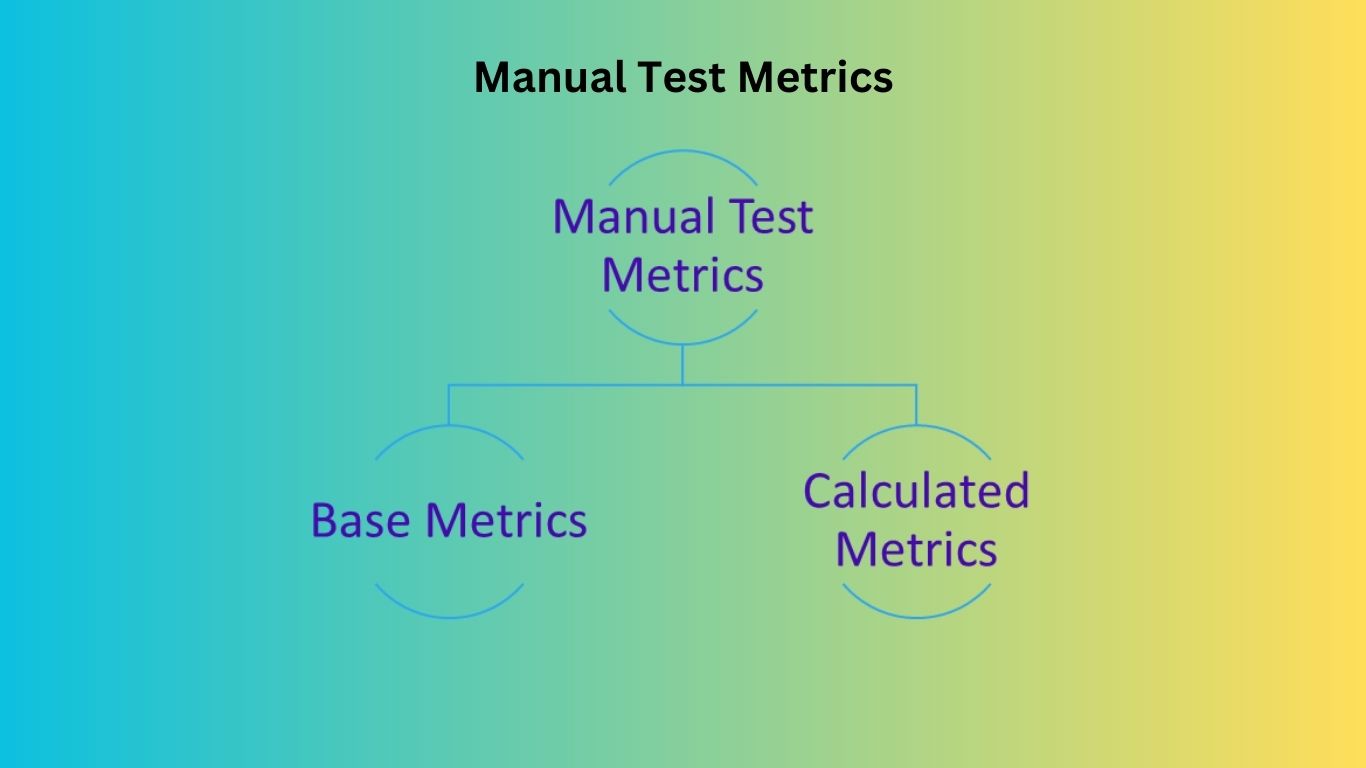
- Manual test metrics are classified into two classes
- Base Metrics
- Calculated Metrics
- Base Metrics- Base Metrics is the raw data collected by
Test Analystduring the test case development and xecution of test cases.
Some examples of base metrics include: Number of test cases executed , Number of test cases.
Major Base Metrics:
| 1. Total number of test cases 2. Number of test cases passed 3. Number of test cases failed 4. Number of test cases blocked 5. Number of defects found 6. Number of defects accepted | 7. Number of defects rejected 8. Number of defects deferred 9. Number of critical defects 10. Number of planned test hours 11. Number of actual test hours 12. Number of bugs found after shipping |
Base Metrics are a great starting point, and can then be used to produce calculated metrics.
- Calculated metrics- Calculated metrics are derived from the data collected in base metrics. Calculated metrics is usually followed by the test manager for test reporting purpose.
Some examples of calculated metrics include:
Percentage Complete: This metric calculates the percentage of test cases executed or test activities completed compared to the total planned test coverage. It indicates the progress of testing efforts.
Test Coverage Percentage: It measures the percentage of requirements, functionalities, or code covered by the executed test cases. This metric helps assess the comprehensiveness of the testing.
Major Calculated Metrics-
-
1. Test Coverage Metrics: Test coverage metrics help answer, “How much of the application was tested?”.
-
Two major Test Coverage Metrics:
- 1.1 Test execution coverage
- 1.2 Requirement coverage
- 1.1 Test execution coverage
This metric gives us an idea of the total tests executed compared to the total number of tests to be run. It is usually presented as a percentage value
- 1.2 Requirement coverage
This metric gives us an idea on the percentage of the requirements that have been covered in our testing compared to the total number of requirements.
-
-
2. Test Effectiveness Metrics: Test Effectiveness Metrics: Test effectiveness answers, “How good were the tests?” or “Are we running high value test cases?” It is a measure of the bug-finding ability and quality of a test set. It can be calculated as follow:
- The higher the test effectiveness percentage, the better the test set is and the lesser the test case maintenance effort will be in the long-term.
- Example: If for a release the test effectiveness is 80%, it means that 20% of the defects got away from the test team.
-
3. Test Effort Metrics: Test effort metrics will answer “how long, how many, and how much” questions about your test effort. These metrics are great to establish baselines for future test planning.
- Major Effort Metrics include:
- 1.1 Number of test runs per time period
- 1.2 Number of defects per hour
- 1.3 Number of bugs per test
- 1.4 Average time to test a bug fix.
- 1.1 Number of test runs per time period
This metric gives us an idea on the number of test runs over a certain period of time. (i.e. 30 tests per one day)
- 1.2 Number of defects per hour
This metric provides information about the rate of finding defects by showing the number of detected defects per test hour.
- 1.3 Number of bugs per test
This metric gives an estimation for the number of defects found in one test. This is calculated by the total number of defects over the total number of conducted testsdividing.
- 1.4 Average time to test a bug fix
This metric presents the average time required to test a bug fix.
Example: Average time to test a defect fix = 4/3 = 1.3 defects per day
Defect Time between fixing the defect and retesting the fix D1 1 Day D2 1 Day D3 2 Day Total 4 - Major Effort Metrics include:
-
4. Test Tracking and Quality Metrics: This metric gives an indication on the quality of the tested application.
-
Major Tracking and Quality Metrics:
- 1.1 Passed Test Cases Percentage
- 1.2 Failed Test Cases Percentage
- 1.3 Critical Defects Percentage
- 1.4 Fixed Defects Percentage
- 1.1 Passed Test Cases Percentage
This metric gives an indication on the quality of the tested application. It shows the percentage of passed test cases in relation to the total number of executed tests.
- 1.2 Failed Test Cases Percentage
This gives an indication on the quality of the tested application. It shows the percentage of failed test cases in relation to the total number of executed tests. It also gives an indication on the effectiveness of the conducted tests.
- 1.3 Critical Defects Percentage
This metric tracks the percentage of the critical defects in relations to the total number of reported defects.
- 1.4 Fixed Defects Percentage
This metric calculates the percentage of the fixed defects in relations to the number of the reported defects. This also gives an indication on the efficiency of testing.
-
-
5. Test Efficiency Metrics: Test efficiency metrics are measurements used to assess the effectiveness and productivity of the testing process.
These metrics provide insights into how efficiently tests are planned, executed, and managed.
- Major Efficiency Metrics include:
- 1.1 Average time to repair defects
- 1.1 Average time to repair defects
This metric calculates the average time taken to repair a defect by dividing the total time taken to fix all bugs over the total number of bugs. This metric gives an indication on how efficient repairing defects is.
- Major Efficiency Metrics include:
In Summary Manual Test Metrics
| Major Base Software Test Metrics | Major Calculated Software Test Metrics |
|---|---|
| Total number of test cases Number of test cases passed Number of test cases failed Number of test cases blocked Number of defects found Number of defects accepted Number of defects rejected Number of defects deferred Number of critical defects Number of planned test hours Number of actual test hours Number of bugs found after shipping | - Coverage - Test Execution Coverage - Requirement Coverage - Effectiveness - Effort - Number of tests run per time - Number of defects per hour - Number of defects per test - Average time to test a bug - Quality - Passed test cases - Failed test cases - Critical test cases - Fixed Defect percentage - Efficiency |
Advantages of Test Metrics
The advantages of using test metrics include:
- Improved Decision-making: Test metrics provide objective data that helps stakeholders make informed decisions regarding software quality, release readiness, and resource allocation.
- Identification of Deficiencies: Metrics highlight areas of the testing process that require improvement, allowing teams to take corrective actions and enhance overall quality.
- Enhanced Communication: Metrics facilitate effective communication among stakeholders by providing a standardized way to convey the status, progress, and effectiveness of testing.
- Process Improvement: Metrics enable teams to identify trends, patterns, and opportunities for process optimization, leading to continuous improvement in testing practices.
Disadvantages of Test Metrics
While test metrics offer numerous benefits, it is essential to consider the following disadvantages:
- Limited Context: Metrics alone may not provide a complete understanding of the software's quality or the testing process's effectiveness. Qualitative insights and human judgment are also crucial.
- Misinterpretation: Metrics can be misinterpreted or manipulated if not presented or analyzed correctly. It is important to provide clear context and explanations to avoid miscommunication.
- Overemphasis on Metrics: Overreliance on metrics may lead to a narrow focus on quantitative measurements, potentially neglecting other critical
aspects of testing, such as exploratory testing or usability evaluation.
Example Execution of Test Metrics in Real Scenarios
To better understand how test metrics are applied in real scenarios, let's consider an example:
Scenario: A software development team is working on a web application for an e-commerce platform. As part of their testing efforts, they track and analyze various test metrics to evaluate the quality of the application.
Test Metrics Used:
- Test Coverage: Measure the percentage of code coverage achieved by the test suite.
- Defect Density: Calculate the average number of defects found per test case or test hour.
- Test Execution Progress: Track the number of test cases executed, passed, and failed over time.
- Defect Removal Efficiency: Evaluate the percentage of defects found and fixed during testing.
- Test Automation Coverage: Measure the ratio of automated test cases to total test cases.
By collecting and analyzing these metrics, the testing team can gain insights into the quality of the application, identify areas that require additional testing or optimization, track their progress over time, and make informed decisions about the release readiness of the software.
In conclusion, test metrics are invaluable tools for evaluating the quality, progress, and efficiency of software testing. By understanding how to create test metrics graphs, knowing when and why to use test metrics, exploring different types of metrics, and considering their advantages, disadvantages, and relevant tools, professionals can effectively leverage test metrics to drive continuous improvement and make informed decisions throughout the testing process.
Remember, while test metrics provide valuable insights, they should be used in conjunction with other testing techniques and qualitative analysis to achieve a comprehensive understanding of the software's quality.